Web Analytics that Measure Website Value for Credit Unions and Banks
If you're a bank or credit union marketer, you should be using an analytics tool to measure your website's impact on your organizational goals. But what metrics are you paying attention to? If you're like most executives, your answer is probably visitor count, page views, referrals and, if you're doing pay-per-click advertising, then PPC spend. But what good are these numbers? How do these metrics translate into dollars, either earned or saved? If those are the only analytics you're paying attention to, you need to read this.
Hits, Views and Visitors Do Not Show Actual Value
Good web analytics packages will allow you to assign monetary values to actions visitors perform on your website. For example, when a visitor applies for a loan, you can record the dollar value associated with that loan.
Larger or more sophisticated financial institutions track these metrics in their CRM, MRM or other back office systems. Many small & mid-size institutions do not have systems or processes to track this data offline, so actual monetary impact of the website goes untracked. Without this data, executives make decisions based on website hits, page views and visitor counts without any correlation to the actual value of those activities. You can do better.
A Simple Example of Tracking Loan Application Values
Every bank and credit union website has online loan applications. (I realize some banks don't have online loan apps, but frankly there is no valid excuse for not having online loan applications in 2011.) Loans have value that you can track easily through web analytics, such as loan principal amount, loan fees and interest revenue. The easiest metric to start with is the actual loan principal value.
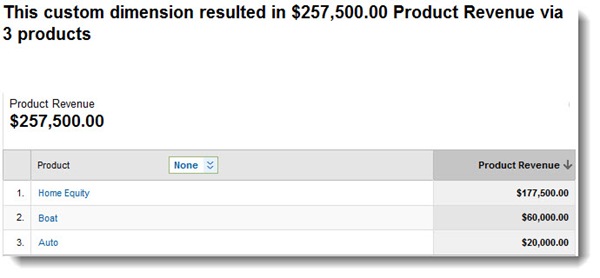
In the example below, we're looking at the online loan app activity for one day for a small credit union. The report shows that three loan types produced applications with a cumulative principal value or $257,500.

Principal value of online loan applications by type
What or Who Drove the Revenue
Knowing the type and dollar amount of loan applications the website produces is a good starting point. It's also helpful to know the which sources drove these applicants to your website.
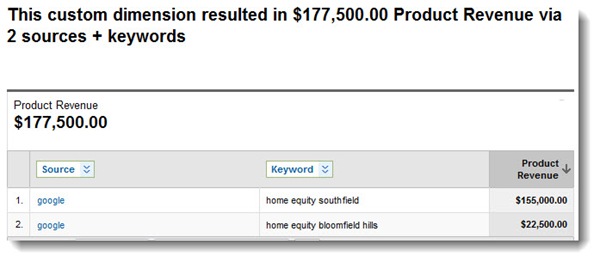
You can see from the report below that when we drill down into the Home Equity loan apps, Google delivered the applicants to the website. You can also see the keywords that the applicants used in Google.

Report showing the referral source for home equity loan apps
Which Campaign Generated Which Loan?
What you can't see in the above report (the data is available, just not in this screen shot) is that a series of pay-per-click campaigns generated these visits.
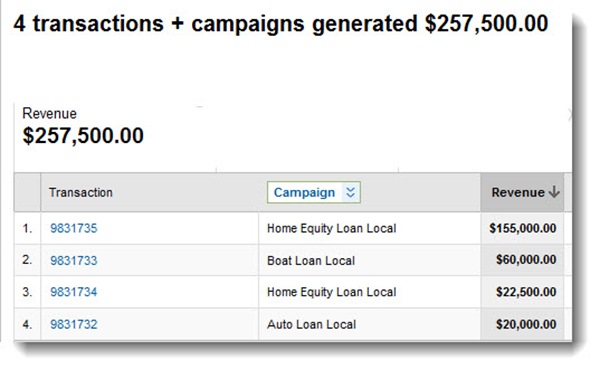
The report below shows each loan application (the Transaction column contains the ID number the website assigns to each loan application) and the campaign that drove the visitor to the website.

Report showing each loan application and which campaign led the visitor to the website
This is a simplistic example, but it illustrates the premise. There are numerous aspects of this tracking that I haven't discussed, such as how we coded the administration side to account for approvals versus declines, as well as handling situations where the approved loan amount differs from the application. That's not important right now. Getting started is important.
Start Now. Get the Budget You've Dreamed About
If you're not tracking this type of data on your website, it's time to start. You probably already have all the technology you need. If you lack motivation, consider how much easier it could be to get your board to approve your budget increase when you can show data like this, rather than hits, visits and page views.
Do you want help improving your web analytics?
Other Recent Blog Posts
Find this useful?
Want to receive our monthly tip to make your website easier to use and safer? No spam, just good advice. Signup!
Interests